Download the Free Template (XLXS)
Make a copy, customize a few columns, and start logging today—no email gate.
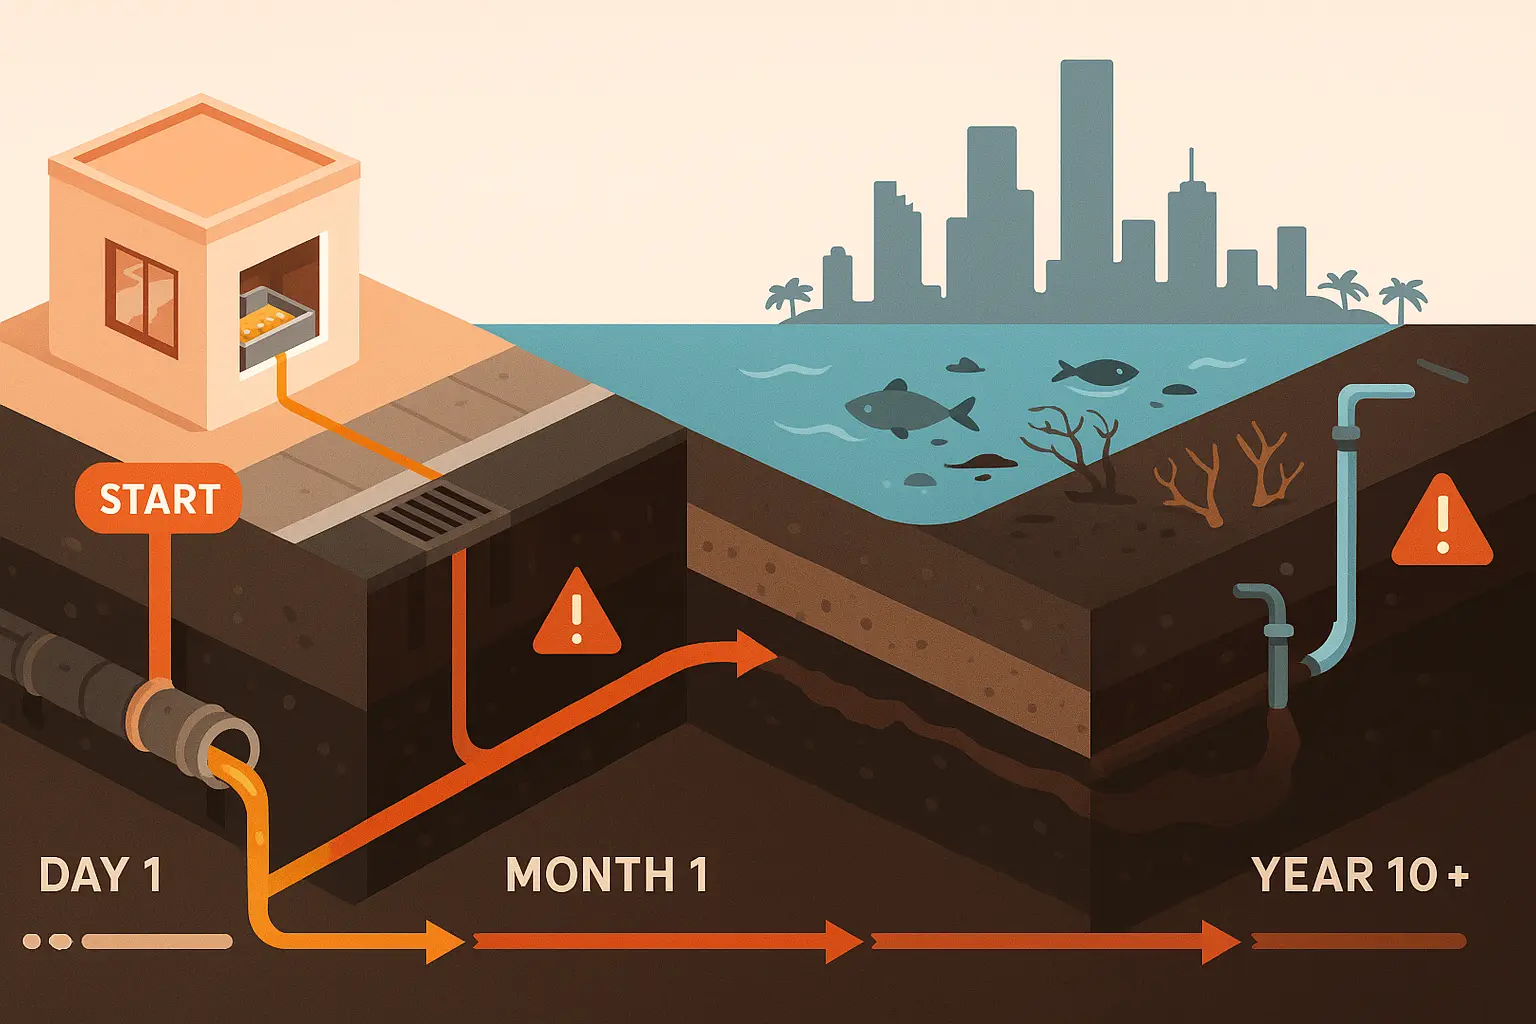
Fryer Oil: Why Audit What Flows In and Slips Away
Fryer oil is liquid cash. A thirty‑five‑pound jug costs about $40 at wholesale prices; lose two jugs a week to leaks, spill‑overs, or bins that never make it to recycling and you have burned through roughly $4,000 a year. Toss in a couple of rush‑hour clogs that demand emergency pump‑outs and the real cost creeps toward five figures. A weekly audit transforms hunches into hard numbers. Suddenly you know which shift under‑filters, whether tonight’s top‑offs match the bill of lading, and how many dollars your hauler’s rebate cheque is missing.
The Four Questions Every Audit Should Answer
- Inventory accuracy: Do the jugs listed on yesterday’s delivery slip actually land in the storeroom?
- Shift performance: Which teams dispose of oil early because “it looks dark,” and which ones get the full life out of each batch?
- Rebate reconciliation: Does the number of gallons the hauler pays for match what left your tank?
- Compliance readiness: Could you hand an inspector every manifest, pump‑out log, and incident record within five minutes?
If the answer to any of those is “I’m not sure,” this template will pay for itself in a single month.
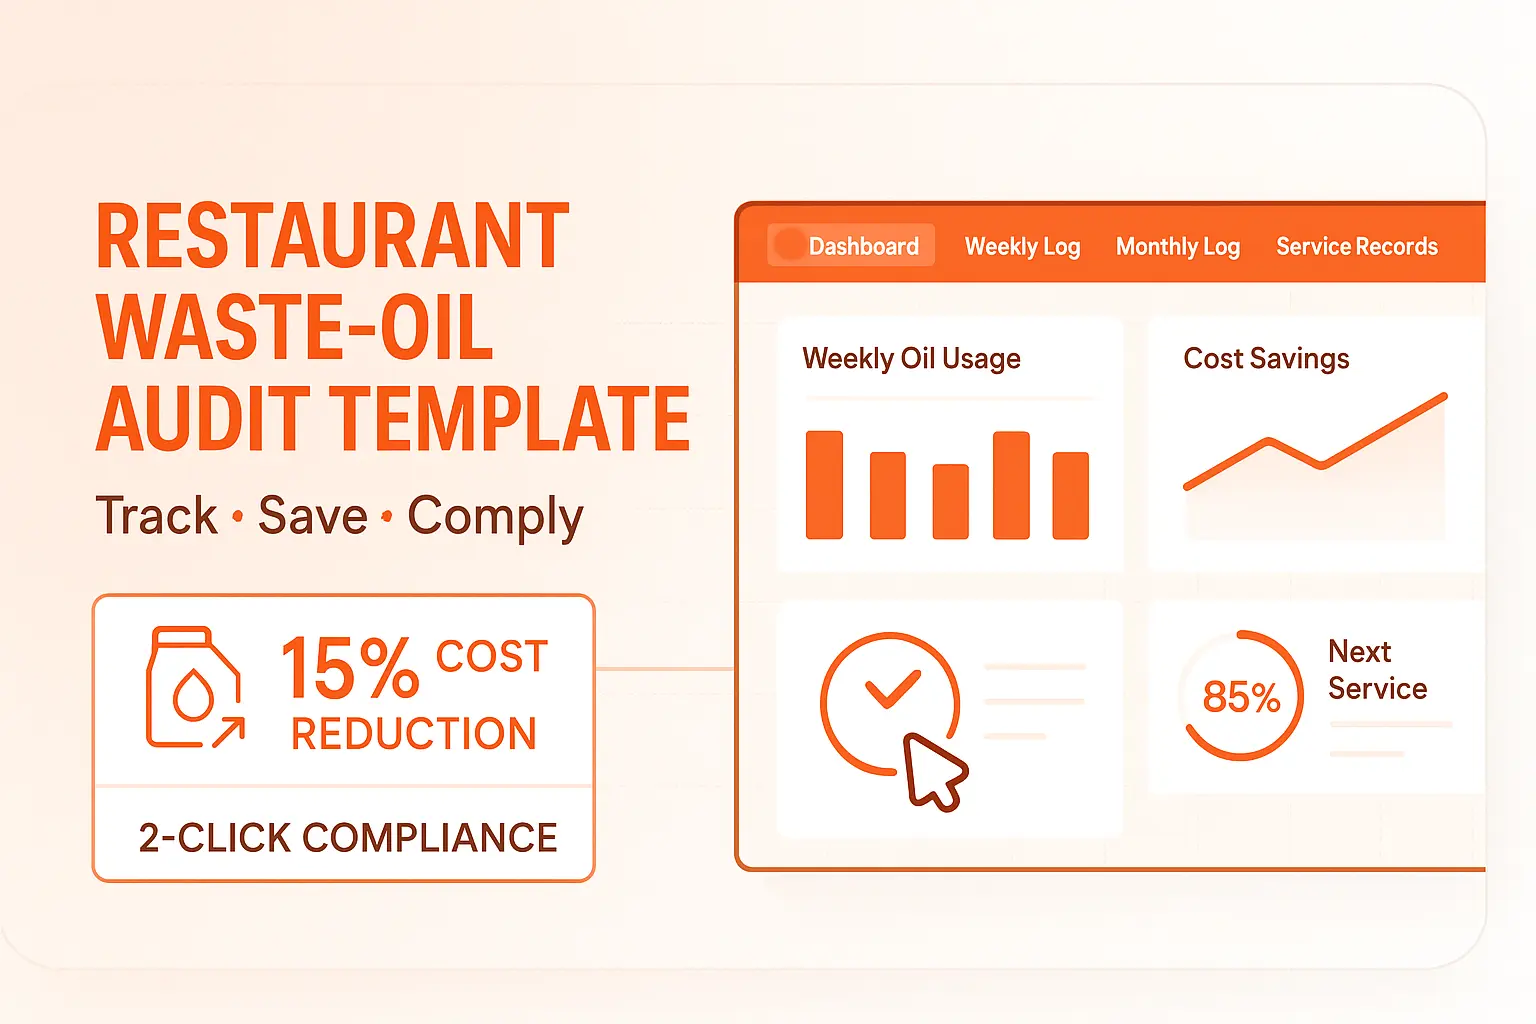
Inside the Template: Four Tabs, No Macros
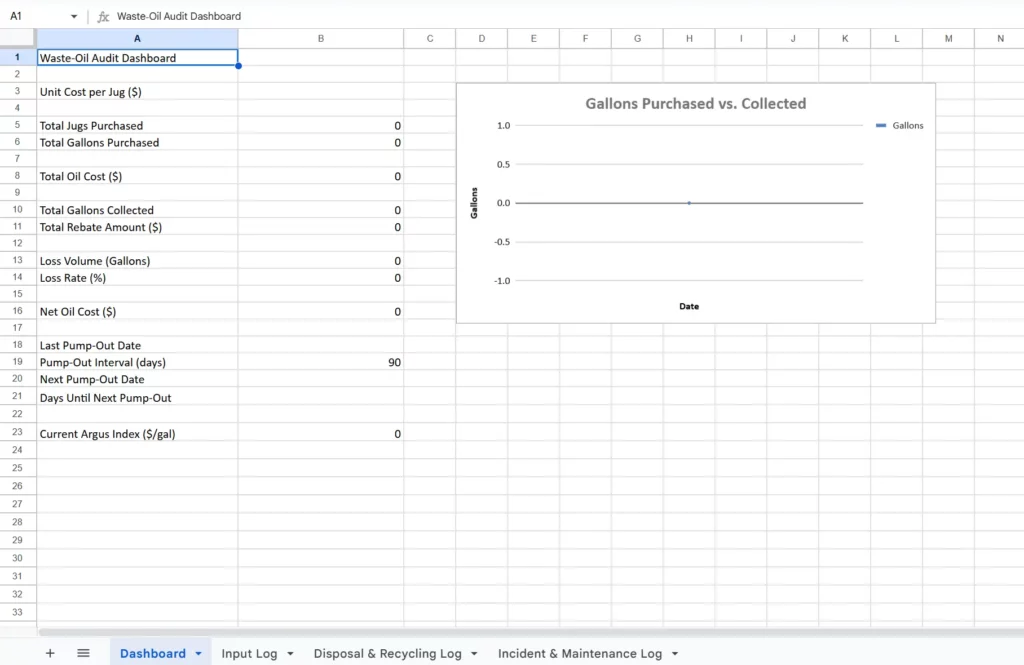
The sheet stays deliberately lightweight—no scripts to break, no add‑ons to update—so a shift manager with basic spreadsheet chops can own the process.
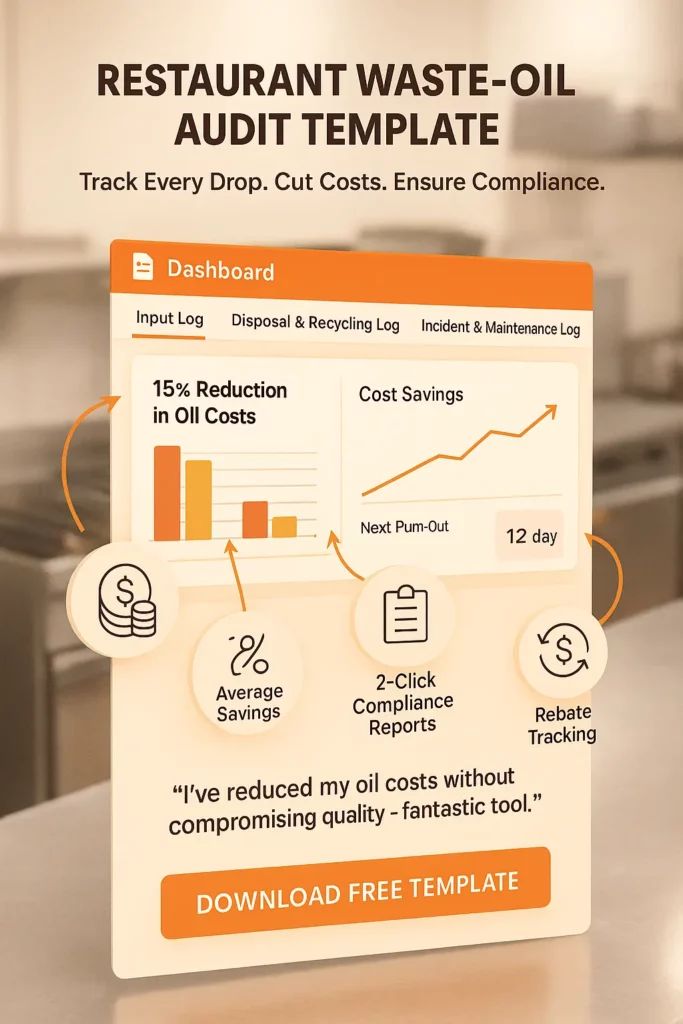
Dashboard — A read‑only landing page pulls live figures from the logs. At a glance you’ll see usage trends, loss rate, rebate revenue, and a countdown to your next grease‑trap pump‑out. Conditional formatting turns problem cells red so nothing hides in a sea of numbers.
Input Log — Enter each delivery’s date, vendor, quantity, cost, and lot code. A tiny formula flags sudden price spikes so you can ring the supplier before sticker shock hits the P&L.
Disposal & Recycling Log — Capture hauler name, transporter ID, manifest number, gallons collected, rebate rate, and cheque amount. A lookup table checks that your rebate keeps pace with the Argus yellow‑grease index—no more under‑payments slipping past busy managers.
Incident & Maintenance Log — Spills, filter breakdowns, and midnight clean‑ups live here, linked to equipment serial numbers for warranty claims and cap‑ex requests.
Roll‑Out Guide: From Zero to Insight in 30 Minutes
- Copy the sheet. Click the download link above and make your own copy.
- Set your unit cost. Cell B3 on the Dashboard holds today’s price per jug. Update it once a week; savings projections adjust automatically.
- Invite your leads. Give shift managers edit rights on the two log tabs. Keep the Dashboard locked so formulas stay intact.
- Log one full week. Even seven days of data uncovers patterns—fish‑fry Fridays in the South or wing nights up North.
- Review and act. Spend five minutes of each Monday pre‑shift huddle scanning the Dashboard, calling out wins, and assigning root‑cause digs for red numbers.
Two Kitchens, Two Very Different Wins
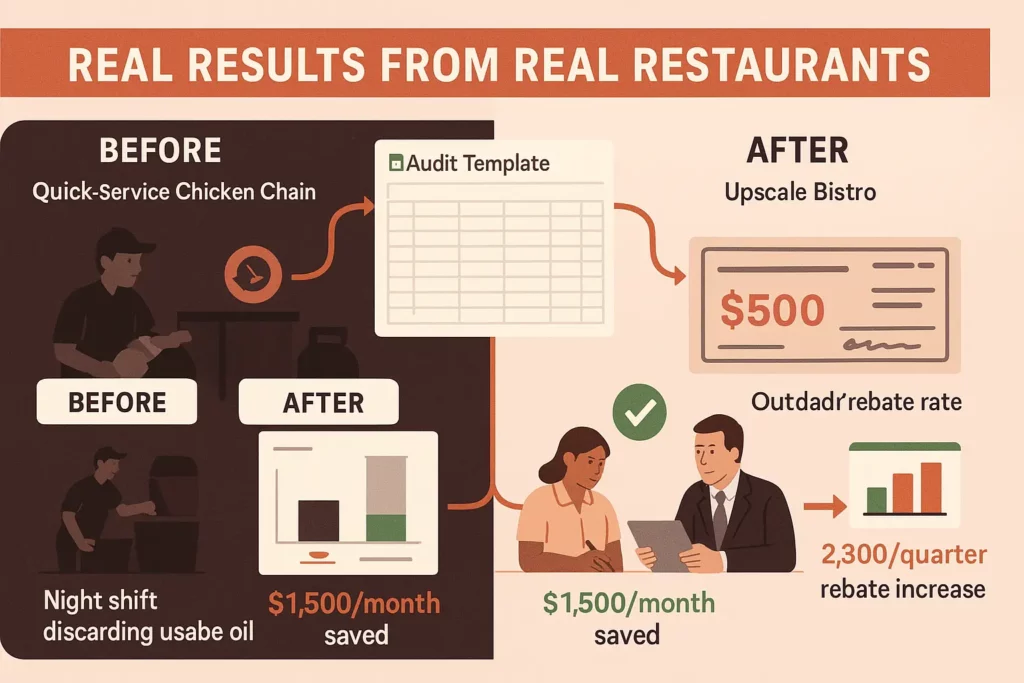
When a quick‑service chicken chain loaded six weeks of numbers the Dashboard lit up in orange: the night shift skipped filtration. A quick retrain and a roll of filter paper trimmed purchases by $1,600 a month.
An upscale bistro group saw something else—rebate dollars lagged behind pickup volumes. The sheet exposed a frozen per‑gallon rate that hadn’t moved in five years. One phone call renegotiated the contract and dropped an extra $2,300 into their quarterly rebate cheque.
From Audit to Compliance in One Tab
Florida, Georgia, New Jersey and a growing list of municipalities now demand digital pump‑out and grease manifests. Because every pickup line in the Disposal Log stores the manifest number and hauler ID, you can export a PDF index with two clicks. Inspectors love timestamped PDFs; you’ll love the five‑minute prep time.
Practical Tweaks That Multiply Savings
Filtering hot oil at the end of each service beats any fancy software. Daily filtration strips out the crumbs that drive free‑fatty‑acid buildup, extending oil life by two shifts. Storing oil under a tight lid keeps condensation—and the bacteria that ride in on moisture—out of the tank. Color‑coded funnels stop fresh oil from ending up in the waste barrel. Keep tanks under eighty‑percent capacity to avoid messy overflow calls. Finally, tie a tiny performance bonus to accurate weekly entries; data grows when cooks know it matters.
Why Excel Sheets Instead of Desktop Software?
Managers run on phones and tablets. Excel Sheets lives wherever the team does, auto‑saves every keystroke, logs version history in case a formula goes missing, and supports inline comments for lightning‑fast shift hand‑offs. No install, no update, no license fee.
Looking ahead, smart tanks can push sensor data straight into the Disposal Log, eliminating manual entry. A point‑of‑sale link adds the missing context of menu mix versus oil turnover. And when haulers sign manifests directly on a tablet, compliance becomes as automatic as a credit‑card receipt.
Common Roadblocks—Solved Before They Start
Most teams stumble not on spreadsheets but on habits. Staff sometimes forget to log entries, so assign the closing cook and tape a laminated logging guide right beside the disposal station. Numbers that refuse to balance usually point to micro‑leaks around fryers or flow meters that were never zeroed. Protect the sheet itself by locking formula cells and leaning on version history for the occasional accidental overwrite.