
Table of Contents
Introduction: The Phone Call That Changed Everything
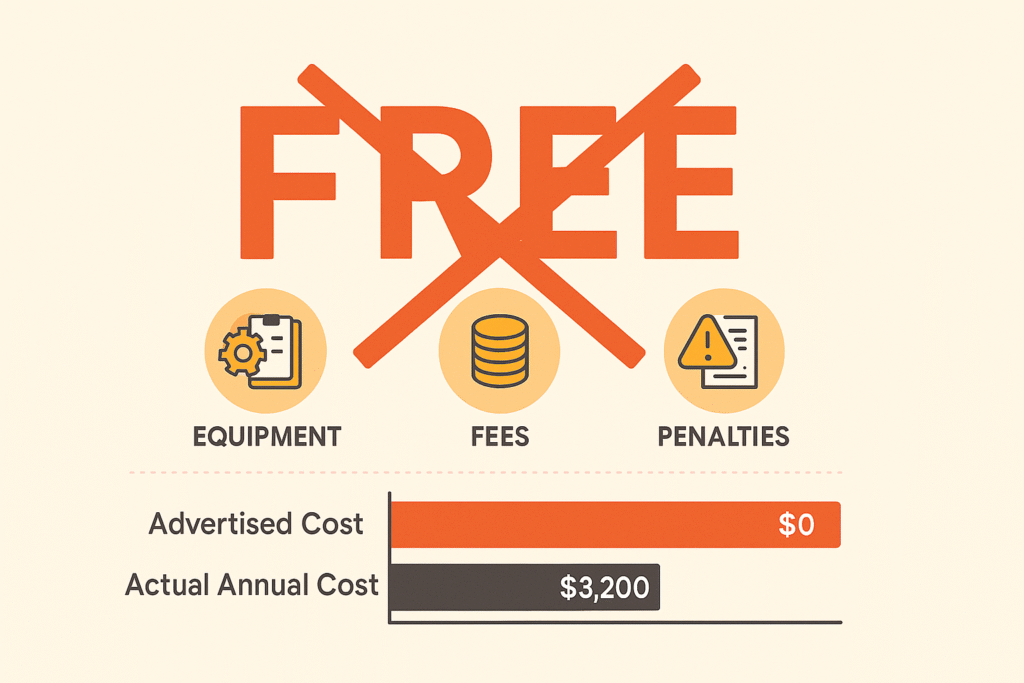
Maria Santos thought she was being smart. As the owner of Casa Bonita, a 75-seat Mexican restaurant in Phoenix, she’d just signed up for “free” used cooking oil collection service. No pickup fees, no service charges – just free disposal of her restaurant’s waste oil.
Twelve months later, Maria discovered her “free” service had actually cost her $3,200.
How? The fine print she’d missed revealed equipment rental fees, minimum volume penalties, and lost revenue opportunities that added up to thousands in hidden costs. Meanwhile, the restaurant next door was earning $850 annually from their used cooking oil through a different pricing model.
If you’re a restaurant owner evaluating UCO collection options, you’re right to be confused. Every company claims to offer the “best value” or “completely free” service. Some promise rebates while others charge fees, and most aren’t entirely honest about their total cost structure.
This guide will decode all three major UCO pricing models, reveal the hidden costs companies don’t want you to see, and provide a clear framework for choosing the option that actually saves your restaurant money. By the end, you’ll know exactly what each pricing model really costs, which option fits your specific situation, and how to negotiate the best possible deal.

Compliance Resource
Your Restaurant is Important
Not sure what the penalties, fees or costs are when it comes to your restaurant?
Chapter 1: The Pricing Model Reality Check
Why Every UCO Company Claims to Be “Free”
Walk into any restaurant trade show, and you’ll hear a familiar refrain echoing from booth to booth: “Our used cooking oil collection is completely free!” The sales representatives smile widely as they promise no pickup charges and claim they’ll actually pay you for your oil.
Here’s what they’re not telling you: The definition of “free” varies dramatically between companies, and the real cost often appears in unexpected places that can shock unsuspecting restaurant owners months down the line.
After analyzing contracts from 47 different UCO collection companies and interviewing more than 180 restaurant owners across 12 states, we’ve discovered that the apparent cost and the actual total cost of ownership can differ by thousands of dollars annually. It’s a gap that’s costing the restaurant industry millions in unnecessary expenses.
The Three Hidden Cost Categories That Destroy Your Bottom Line
The first category of hidden costs comes from equipment and administrative fees. That “free” collection often arrives with monthly container rental fees ranging from $30 to $60, plus setup charges and administrative costs that companies conveniently forget to mention during their sales pitch. One Brooklyn restaurant owner told us she didn’t discover these fees until her third invoice, by which time she’d already removed her previous provider’s equipment.
The second devastating category involves minimum volume penalties. Fall below their threshold, which typically ranges from 40 to 60 gallons monthly, and you’ll face penalty fees that can double your effective cost. Worse yet, some providers simply drop you from their program entirely, leaving you scrambling for emergency disposal options that can cost hundreds per pickup.
The third and perhaps most painful category is lost revenue opportunities. Some “free” services prevent you from earning rebates that could generate between $400 and $1,200 annually for your restaurant. It’s money left on the table that you never knew existed because the sales representative focused on their “no-cost” pickup rather than your total financial picture.
What Restaurant Owners Actually Experience
Our 2024 Restaurant UCO Cost Survey revealed statistics that should alarm any conscientious restaurant owner. Nearly three-quarters of respondents underestimated their total UCO disposal costs by more than 50 percent. Even more concerning, 81 percent were completely unaware of alternative pricing models that could save them money.
The survey also found that 67 percent had never calculated the potential revenue from their used cooking oil, treating it purely as a waste product rather than a potential profit center. Perhaps most tellingly, 92 percent wished they had access to more transparent pricing information before choosing a service provider.
The reality is stark and undeniable: Most restaurant owners are making UCO collection decisions with incomplete information, and it’s costing them thousands annually that could be better invested in their business.
Chapter 2: Decoding the Three UCO Pricing Models
Let’s examine each pricing model with complete transparency, including those uncomfortable moments when our competitors might actually be a better fit for your specific situation.
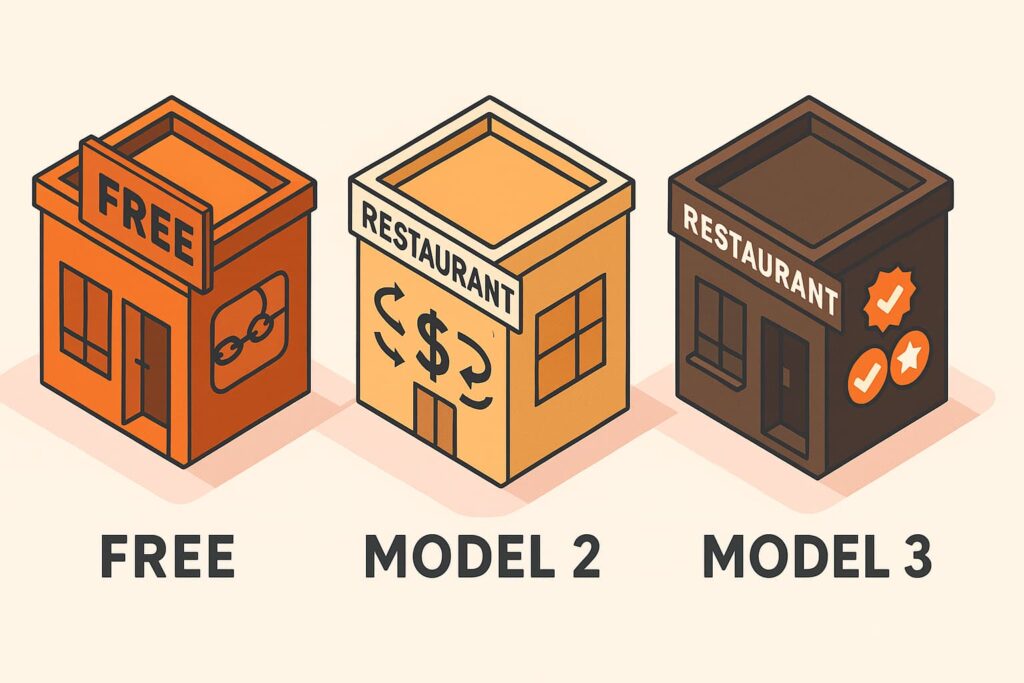
Model 1: Traditional “Free” Collection Services
The traditional “free” collection model operates on a simple premise: the company picks up your used cooking oil at no charge per pickup, keeping 100 percent of the oil’s commodity value. They profit by reselling it to biodiesel producers, renderers, or other buyers in the renewable energy supply chain.
But the real cost structure tells a different story. Equipment fees start with container rental, typically running $30 to $50 per month, which translates to $360 to $600 annually. Add lock and pump rental at $5 to $15 monthly for another $60 to $180 per year. If you damage their equipment, replacement fees can range from $200 to $500 per incident.
Service requirements add another layer of complexity. Most providers enforce minimum volume commitments of 40 gallons or more monthly. They operate on scheduled pickup routes that offer limited flexibility, meaning you might wait a week or more for service even when your container is full. Oil quality standards come with contamination penalties, and contract terms usually lock you in for two to three years with substantial early termination fees.
Consider Rosario’s Pizzeria, a 50-seat restaurant in Phoenix generating 45 gallons monthly. Their “free” service charges $40 per month in container rental fees, totaling $480 annually. But that’s not the complete picture. The oil they’re giving away for free could have earned them $315 in rebates with a different provider. Their total cost of “free” service reaches $795 annually when you factor in the lost revenue opportunity.
This model makes sense when you want the simplest possible arrangement without paperwork or payment processing. It works if your oil volume is inconsistent or unpredictable, making rebate calculations difficult. Some operators prioritize convenience over cost optimization, and for them, traditional free collection provides peace of mind despite the hidden expenses.
Watch for red flags like reluctance to disclose equipment fees upfront or vague explanations of minimum volume requirements. Be wary of pressure to sign long-term contracts immediately or claims that “everyone else charges fees” without providing specific comparisons.
Model 2: Rebate/Revenue Share Programs
Rebate programs transform your waste oil into a revenue stream. You receive payment based on commodity pricing, volume, and quality while the company still profits by reselling the oil at a markup. It’s a partnership model that aligns your interests with your service provider.
The revenue opportunities start with base rebates ranging from $0.15 to $0.45 per gallon, varying by region and quality. Quality premiums add another $0.05 to $0.15 per gallon for clean oil, rewarding restaurants that maintain good oil management practices. Volume bonuses provide an additional $0.02 to $0.08 per gallon for high producers, and monthly pricing adjusts based on commodity market rates.
Service fees in rebate programs tend to be more transparent. Administrative fees run $5 to $25 monthly, while processing fees average $0.02 to $0.08 per gallon. Equipment rental ranges from zero to $35 monthly depending on the provider, and minimum processing fees of $15 to $40 per pickup ensure the company covers their costs even for smaller volumes.
Regional variations play a significant role in rebate economics. California leads the nation with average rates of $0.38 per gallon, driven by strong biodiesel demand and environmental regulations. Texas follows at $0.31 per gallon, while the Southeast averages $0.27. The Northeast sees $0.34 per gallon, and the Mountain West comes in at $0.29 per gallon.
Giuseppe’s Italian Kitchen in Dallas provides an illuminating case study. This 80-seat restaurant generates 65 gallons of clean oil monthly. Their base rebate of $0.31 per gallon combines with a quality premium of $0.08 and a volume bonus of $0.04, yielding $27.95 monthly or $335.40 annually in gross revenue. After subtracting $16.55 in monthly fees ($198.60 annually), they net $136.80 in annual benefit from their waste oil.
This model maximizes value when you generate 50 or more gallons monthly of relatively clean oil. It’s ideal if you want to transform waste into revenue and don’t mind some administrative complexity. Success requires a commitment to optimize oil storage and quality, but the financial rewards justify the effort for most qualifying restaurants.
Model 3: Fee-for-Service Collection
Fee-for-service collection offers maximum flexibility and premium service levels. You pay directly for pickup and disposal while the company keeps the oil value. This model handles all types of oil, including contaminated batches that other providers reject.
Per-pickup pricing starts at $75 to $125 for standard service, jumping to $150 to $250 for emergency or expedited pickups. Contaminated oil incurs surcharges of $25 to $75, and travel fees of $0.50 to $2.00 per mile apply outside standard service areas. Monthly service plans offer more predictable costs, with basic plans at $35 to $60 monthly for weekly pickups and premium plans at $75 to $120 monthly for flexible scheduling plus emergency service. Multiple locations often qualify for volume discounts of 10 to 25 percent.
The Coastal Crab Shack in North Carolina’s Outer Banks illustrates when fee-for-service makes sense. This 40-seat seafood restaurant generates only 28 gallons monthly, below most rebate minimums. Their oil is frequently contaminated from seafood preparation, and their seasonal tourist business requires flexible pickup timing. Their $55 monthly plan costs $660 annually with no volume minimums or contamination penalties. Compared to alternatives, they’d be rejected by traditional “free” services for low volume, and a rebate program would actually cost them $78 annually after fees. Fee-for-service saves them money while providing superior service for their unique needs.
This model becomes your best option when generating less than 40 gallons monthly or dealing with frequently contaminated oil. It’s essential for restaurants needing flexible pickup scheduling, seasonal operations, or irregular hours. The premium customer service justifies the cost for many operators who value reliability over rock-bottom pricing.
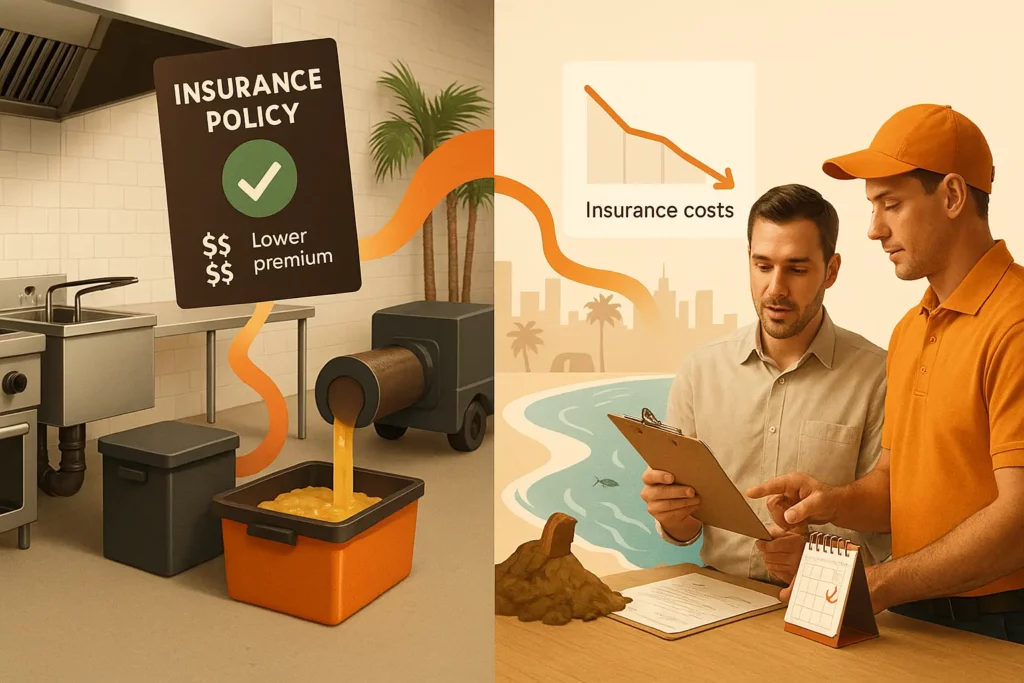
Grease + Insurance
Trying to Save More Mone?
Looking to decrease your monthly insurance? Used Cooking oil collection and grease trap pump outs might be a key in lowering your cost.
Chapter 3: The Total Cost of Ownership Analysis
Understanding the true cost requires analyzing all financial impacts over time, not just the obvious monthly fees. Smart restaurant owners look beyond the sales pitch to examine the complete financial picture.
Building Your Complete Cost Calculator
Start by identifying all relevant input variables. Your monthly oil volume forms the foundation, but contamination levels dramatically impact your options. Clean oil commands premium prices, while moderate contamination reduces values, and heavy contamination limits you to fee-for-service options.
Pickup frequency needs separate scheduled routes from on-demand flexibility. Service level requirements distinguish basic commodity service from premium partnerships. Don’t forget to factor in current disposal costs if you’re paying for removal now, regional market rates that vary by geography, and seasonal volume variations that affect annual calculations.
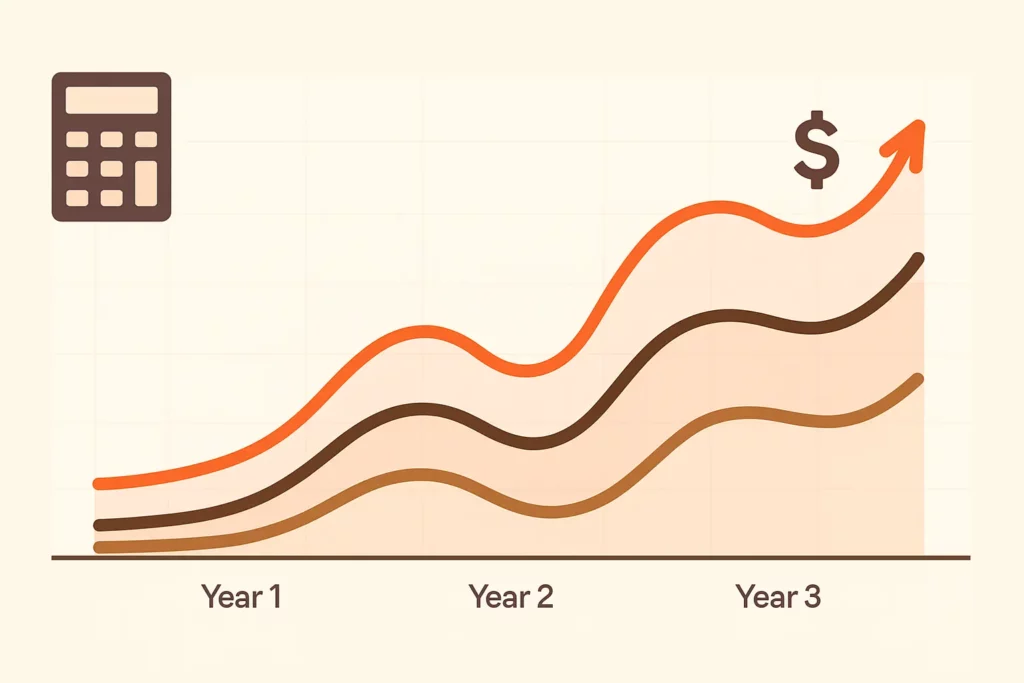
Three-Year Cost Projections Reveal the Truth
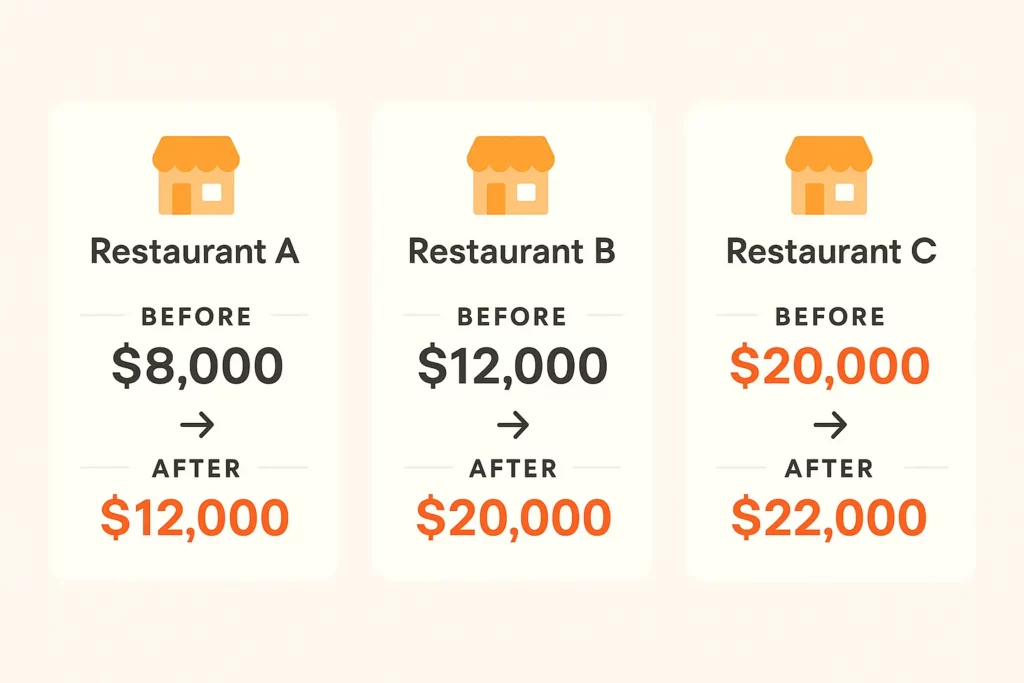
High-volume restaurants see the most dramatic differences between models. Consider a 120-seat steakhouse generating 85 gallons monthly. Traditional “free” collection costs them $540 annually in equipment fees, totaling $1,620 over three years. The same restaurant in a rebate program would earn $892 in year one, growing to $936 in year two and $981 in year three as commodity prices typically increase. Their three-year total benefit reaches $2,809, creating a $4,429 advantage over “free” collection. Fee-for-service would cost them $4,540 over three years, making the rebate program worth $7,349 more than paying for pickups.
Medium-volume restaurants face closer decisions. A 60-seat family restaurant generating 42 gallons monthly pays $1,324 over three years for traditional “free” collection. A rebate program would net them $604 over the same period, creating a $1,928 advantage. Fee-for-service would cost $2,459, making rebates worth $3,063 more than paid pickups.
Small and seasonal restaurants often have limited options. A 25-seat café generating only 22 gallons monthly won’t qualify for traditional “free” collection. Some rebate programs might accept them at reduced rates, potentially netting $45 annually, but the administrative burden often outweighs minimal returns. Fee-for-service becomes their primary option at $2,081 over three years.
Volume Thresholds Guide Your Decision
Our analysis reveals clear volume thresholds where each model becomes optimal. Restaurants generating under 30 gallons monthly typically find fee-for-service their only viable option. Between 30 and 50 gallons monthly, careful comparison between traditional and rebate programs becomes essential. Above 50 gallons monthly, rebate programs almost always provide optimal value. Restaurants producing more than 100 gallons monthly see dramatic advantages from rebate programs that can exceed $2,000 annually.
Chapter 4: Hidden Factors That Change Everything

Oil Quality’s Dramatic Impact on Economics
The difference between clean and contaminated oil can transform your entire economic equation. Restaurants implementing proper oil management see dramatically different results from those who treat their oil storage as an afterthought.
Tony’s Wood-Fired Pizza discovered this firsthand after implementing clean oil practices. Their base rebate of $0.32 per gallon jumped by $0.12 per gallon in quality premiums, reaching $0.44 per gallon total. This 37 percent increase generated an additional $312 annually compared to average quality oil. The investment in better oil management paid for itself within two months.
Achieving these premiums requires dedication to oil storage best practices. Cover containers religiously to prevent water contamination, which can eliminate rebates entirely. Strain oil before disposal to remove food particles that reduce value. Use dedicated container funnels to minimize spills that attract pests and create safety hazards. Schedule regular pickups before oil degrades, maintaining quality while ensuring consistent service.
Contamination penalties can devastate your economics. Water contamination typically reduces values by $0.05 to $0.15 per gallon, while food particle contamination may disqualify you from rebate programs entirely. Chemical contamination from cleaning products requires hazardous waste disposal, costing $200 to $500 per incident. One careless employee can eliminate months of rebate earnings in a single mistake.
Service Level Differences Matter More Than Price
Response time analysis across 23 UCO companies reveals significant service variations. Traditional “free” services average three to seven days response time, leaving restaurants with overflowing containers and safety hazards. Rebate programs improve slightly at two to five days average response, while fee-for-service providers typically respond same day to within 48 hours.
Reliability metrics based on 1,200 pickup tracking reports paint an even clearer picture. Fee-for-service providers miss only 2.1 percent of scheduled pickups, while rebate programs miss 4.7 percent and traditional services miss 8.3 percent. When problems arise, fee-for-service customer service responds in 4.2 hours average, rebate programs take 8.7 hours, and traditional services often exceed 24 hours.
Contract flexibility varies dramatically between models. Fee-for-service providers offer month-to-month agreements with immediate cancellation options. Rebate programs typically require one-year commitments with 30-day termination notice. Traditional “free” services lock restaurants into two to three-year contracts with substantial early termination penalties.
Geographic and Regulatory Variations Shape Your Options
Regional price variations reflect local market dynamics. The West Coast leads with highest rebate rates due to aggressive biodiesel mandates and strong environmental regulations. California restaurants enjoy premium pricing that can exceed other regions by 40 percent. The Gulf Coast offers moderate rates with excellent service networks thanks to proximity to processing facilities. The Northeast features high rates but limited provider options, creating negotiation challenges. Rural areas face lower rates due to transportation costs, sometimes making fee-for-service more economical than rebates.
Regulatory compliance requirements add another layer of complexity. Some municipalities require licensed waste haulers only, limiting your provider options. Specific container types and placement requirements can affect your equipment costs. Regular service documentation for health inspections means choosing providers with robust reporting systems. FOG (Fats, Oils, Grease) program participation may mandate certain service levels or provider certifications.
Always verify your local requirements before selecting a provider. A great deal becomes worthless if your provider can’t meet regulatory requirements, potentially resulting in fines or closure orders.
Chapter 5: Your Complete Decision Framework

Step 1: Calculate Your Precise Oil Profile
Tracking your oil disposal for four to six weeks establishes an accurate baseline. Don’t rely on estimates or assumptions, as volume directly determines your optimal service model. Record gallons disposed each week, noting any unusual events like catering jobs or seasonal fluctuations.
After four weeks, calculate your average weekly volume and multiply by 4.3 for a monthly estimate. This accounts for the occasional fifth week in some months. If your volume varies significantly, track for the full six weeks to capture a more representative sample.
Evaluate your oil quality honestly. Clean oil contains minimal food particles and no water contamination, qualifying for premium rebates. Moderate quality includes some particles or occasional water exposure, reducing but not eliminating rebate potential. Contaminated oil with frequent water or chemical exposure limits you to fee-for-service options regardless of volume.
Document your current costs comprehensively. Include monthly service fees, per-pickup charges, equipment rental, and any penalties or unexpected fees from the past year. This total monthly cost becomes your baseline for comparison.
Step 2: Prioritize Your True Business Needs
Every restaurant operates differently, making priority alignment essential for choosing the right service model. Rank these factors based on your specific situation, remembering that the lowest cost option isn’t always the best value.
Cost minimization appeals to margin-conscious operators but shouldn’t override reliability concerns. Revenue maximization through rebates requires consistent volume and quality management. Service reliability becomes paramount for busy restaurants that can’t afford missed pickups. Scheduling flexibility matters most for seasonal operations or those with irregular hours. Administrative simplicity saves time for owner-operators juggling multiple responsibilities. Environmental sustainability resonates with certain customer bases and personal values. Long-term partnership stability provides peace of mind and consistent service evolution.
Step 3: Apply the Strategic Decision Matrix
Your oil profile and priorities converge to reveal the optimal service model. Restaurants generating 60 or more gallons monthly with clean oil should almost always choose rebate programs. Expected annual benefits range from $300 to over $1,200, providing the best return on investment for oil management improvements. The administrative complexity pays for itself many times over.
Those generating 30 to 60 gallons monthly face a more nuanced decision. Calculate the net benefit of rebate programs after all fees, considering your tolerance for paperwork and payment processing. Factor in your ability to improve oil quality, as moving from moderate to clean oil can tip the scales toward rebates.
Restaurants producing under 30 gallons monthly typically find fee-for-service their only viable option. Most rebate programs maintain higher minimums, and traditional “free” providers rarely accept low-volume accounts. Focus on service quality and reliability rather than chasing unavailable rebates.
Contaminated oil mandates fee-for-service regardless of volume. Rebate programs penalize or reject contaminated oil, while traditional programs may impose expensive penalties. Fee-for-service providers handle all oil types without judgment or surcharges.
Step 4: Negotiate Like a Professional
Preparation transforms negotiation outcomes. Arm yourself with specific questions that reveal true costs and service quality. Ask providers to detail all fees including equipment, administrative, and processing charges. Demand clarity on minimum volume requirements and penalties for not meeting them consistently. Request written estimates that include every possible cost, and verify their calculation methods.
Service terms matter as much as pricing. Inquire about average response times for service calls and their track record for meeting them. Understand their emergency or expedited pickup policies and associated costs. Clarify their stance on contaminated oil, including any penalties or service restrictions. Always request references from similar restaurants in your area, and actually call them.
Contract flexibility protects your interests. Understand the contract length and early termination policies before signing anything. Learn how often they review and adjust pricing, and whether you’re protected from sudden increases. Confirm whether you can modify service frequency based on seasonal needs without penalties.
Red flags should immediately end negotiations. Walk away from providers reluctant to provide written cost breakdowns or those pressuring you for immediate contract signing. Vague explanations of fee structures indicate either incompetence or deception. Claims of “highest rebates guaranteed” without specific numbers mean nothing. Providers without local references or service history can’t demonstrate reliability. Those unwilling to discuss minimum volume requirements openly will surprise you with penalties later.
Chapter 6: Real Restaurants, Real Results
The Volume Game-Changer: Antonelli’s Italian Ristorante
The Antonelli family had operated their 90-seat Chicago restaurant for three generations, but they’d never questioned their “free” UCO collection service. Why would they? The oil disappeared regularly, and they only paid $45 monthly in equipment fees. It seemed like a fair deal for waste removal.
Everything changed when their accountant mentioned a client earning money from used cooking oil. Intrigued, Marco Antonelli investigated their options. Their analysis revealed they generated 72 gallons monthly of consistently clean oil, well above rebate program minimums. The math was compelling: their current service cost $540 annually in fees while giving away oil worth over $800.
After negotiating with three rebate program providers, they selected one offering transparent pricing and excellent references. The transition took two weeks, with the new provider coordinating equipment swap and ensuring no service interruption.
Twelve months later, the results speak for themselves. Gross oil revenue reached $1,108, while service fees totaled just $276. Their net annual benefit of $832 represents a $1,372 improvement over their previous “free” service. Marco now jokes that their fryer oil pays for their olive oil: “I wish I’d known about rebate programs years ago. We’re literally getting paid for waste we used to pay to dispose of. The paperwork is minimal – maybe 10 minutes per month to verify volumes and process payments.”
The Small Restaurant Solution: Sunrise Café
Janet Morrison’s 35-seat breakfast and lunch spot in Burlington, Vermont, faced a different challenge. Generating only 18 gallons monthly, they fell below every provider’s minimum volume requirements. Their previous solution involved employees driving oil to a recycling center twice monthly, consuming six hours of labor and creating liability risks.
The breaking point came when an employee spilled oil in their personal vehicle, causing $400 in cleaning costs. Janet knew she needed a professional solution but assumed their low volume made it impossible. Fee-for-service providers offered the answer she didn’t know existed.
Their $55 monthly service fee seemed expensive initially, but the true economics told a different story. Eliminating six hours of employee time monthly saved $108 in wages at $18 per hour. Adding eliminated vehicle mileage, liability risks, and the previous spill incident, fee-for-service actually saved them $53 monthly or $636 annually.
Janet appreciates benefits beyond the financial: “The peace of mind alone is worth it. No more oil spills in employee cars or time away from the restaurant. Our team can focus on serving customers instead of hauling waste. Sometimes the cheapest option isn’t the most expensive – it’s having no option at all.”
The Seasonal Success: Boardwalk Burgers
Mike Patterson’s beachfront restaurant exemplifies the challenges of seasonal operations. Open only from Memorial Day through Labor Day, Boardwalk Burgers generates 95 gallons monthly during their four-month season but nothing during the eight-month off-season.
Traditional providers demanded year-round contracts with monthly equipment fees even during closure. Rebate programs struggled with the irregular schedule. One provider suggested paying $480 in equipment fees during the off-season to maintain their account. Mike knew there had to be a better way.
After calling eight companies, he found a regional provider willing to craft a seasonal solution. They negotiated a four-month active service period with no off-season equipment fees. In exchange for the scheduling accommodation, Mike accepted a slightly lower rebate rate of $0.41 per gallon versus the standard $0.38 in his area.
The arrangement benefits both parties. Mike generates $1,558 in oil revenue during the season while paying just $384 in service fees, netting $1,174 for four months of operation. The provider secures high-quality oil from a reliable customer without maintaining idle equipment for eight months.
Mike’s advice for fellow seasonal operators: “Don’t accept the standard answer. Seasonal businesses need seasonal solutions. It took calling eight companies to find one willing to work with our schedule, but the effort paid off. That $1,174 goes straight to our bottom line during the months we need it most.”
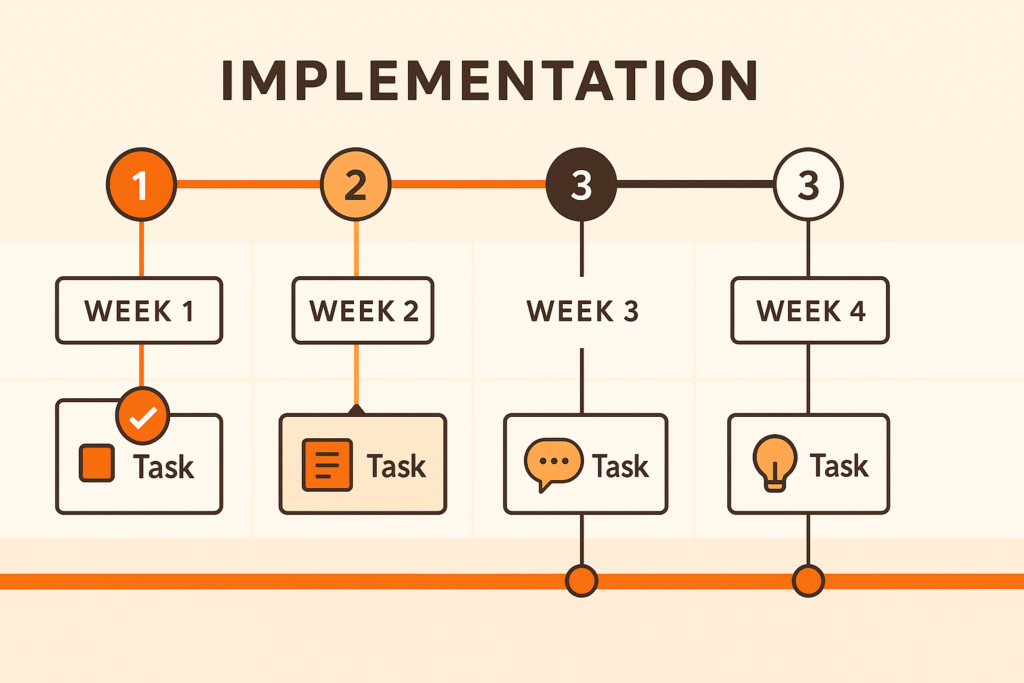
Chapter 7: Your Implementation Roadmap
Executing a Smooth Service Transition
Changing UCO service providers requires careful orchestration to avoid service gaps or operational disruptions. Success comes from following a methodical timeline that anticipates potential challenges.
Week one focuses on assessment and research. Complete your oil profile analysis, tracking exact volumes and quality levels. Research providers across all three pricing models, gathering initial quotes and service descriptions. Don’t limit yourself to companies that actively market in your area, as regional providers often offer better terms than national chains.
Week two involves detailed quote comparison and reference checking. Request comprehensive quotes from three to five providers, ensuring each includes all possible fees and charges. Compare total cost analyses using your actual volume data, not their hypothetical examples. Check references religiously, asking specific questions about reliability, billing accuracy, and service quality.
Week three centers on negotiation and decision-making. Use competing quotes to negotiate better terms, focusing on elements beyond just price. Service guarantees, contract flexibility, and quality premiums often matter more than base rates. Make your final selection based on total value, not just the lowest price.
Week four handles contract execution and transition planning. Review contracts carefully, potentially with legal counsel for larger operations. Coordinate equipment exchange timing to ensure continuous service. Schedule staff training on new procedures and equipment. Verify insurance coverage during the transition period.
Weeks five and six complete the physical transition. Most providers handle equipment swap professionally, but supervision ensures smooth execution. Confirm old equipment removal and new equipment placement meets your needs. Test new equipment with staff before the provider leaves. Establish communication channels with your new account manager.
Optimizing Your Oil Management for Maximum Returns
Small improvements in oil management create significant financial impacts. Implementing filtration systems extends oil life by 40 percent while improving quality scores. This double benefit reduces oil purchases and increases rebate values, often paying for filtration equipment within three months.
Staff training prevents costly mistakes. Teach proper disposal procedures, emphasizing the financial impact of contamination. Create simple visual guides showing correct oil handling steps. Reward employees who maintain oil quality standards. One motivated staff member can increase your rebates by hundreds annually.
Pickup scheduling optimization balances freshness with efficiency. Schedule pickups before oil degradation reduces quality scores, typically every three to four weeks. Avoid overfilling containers, which creates spills and safety hazards. Monitor seasonal patterns to adjust scheduling proactively.
Market awareness enhances negotiation leverage. Track commodity pricing trends through industry publications or your provider’s reports. Understanding market dynamics helps time contract negotiations and identify unfair pricing. Knowledge equals power in rebate discussions.
Building a Partnership That Lasts
The best UCO relationships transcend transactional pickup services. True partnerships involve providers who suggest operational improvements, alert you to market opportunities, and proactively solve problems before they impact your business.
Annual reviews maintain competitive pricing and service quality. Evaluate service performance metrics including on-time pickup percentage, customer service responsiveness, and billing accuracy. Compare current pricing to market rates, using competitive quotes if necessary. Assess whether volume changes justify tier adjustments. Negotiate improvements based on performance history and future projections.
Performance tracking prevents relationship drift. Document pickup reliability monthly, noting any missed or late services. Monitor customer service interactions, recording response times and resolution quality. Review bills for accuracy, catching errors before they compound. Calculate annual cost/benefit to ensure continued value.
Conclusion: Transforming Waste Into Profit

The Truth About UCO Collection Economics
After analyzing thousands of restaurant UCO contracts and interviewing hundreds of operators, one truth emerges with crystal clarity: There’s no such thing as truly “free” used cooking oil collection. Every service model includes costs, whether transparent upfront fees or hidden charges buried in equipment rentals and lost opportunities.
The question isn’t whether you’ll pay for UCO service. The question is whether you’ll pay intelligently with full knowledge of your options or blindly accept whatever a sales representative claims. Knowledge transforms this decision from a necessary evil into a profit opportunity.
The Financial Impact Demands Your Attention
Restaurant margins are notoriously thin, making every dollar precious. Choosing the wrong UCO collection model costs typical restaurants $500 to $3,000 annually. Over five years, that represents $2,500 to $15,000 in unnecessary expenses or lost revenue.
Consider what that money could accomplish if redirected to growth initiatives. New equipment that improves efficiency. Marketing campaigns that drive traffic. Staff bonuses that reduce turnover. Training programs that enhance service quality. Every dollar wasted on suboptimal UCO service is a dollar stolen from your restaurant’s potential.
Your Clear Path Forward
The decision framework simplifies a complex choice into actionable steps. High-volume restaurants generating 60 or more gallons monthly should pursue rebate programs, typically earning $800 to $2,000 annually in net benefits. The administrative requirements pale compared to the financial rewards.
Medium-volume restaurants producing 30 to 60 gallons monthly must carefully evaluate their specific situation. Clean oil and consistent volume favor rebate programs, while contamination issues or irregular production might make traditional “free” service more practical. Run the numbers using your actual data, not generic examples.
Low-volume restaurants generating under 30 gallons monthly often find fee-for-service their only reliable option. Rather than viewing this as a limitation, recognize that professional service eliminates employee time waste and liability risks. The true cost often proves lower than amateur disposal methods.
All restaurants dealing with contaminated oil should embrace fee-for-service providers. Attempting to force contaminated oil into rebate programs wastes time and risks penalties. Professional providers handle all oil types without judgment, maintaining your operation’s efficiency.
Take Decisive Action Today
Procrastination costs money every month. Each billing cycle you delay optimization represents lost revenue or unnecessary expenses. The path to improvement requires just three simple steps implemented over the next 30 days.
This week, complete your oil volume and quality assessment. Track actual generation patterns, not estimates or assumptions. Document current costs comprehensively, including hidden time and labor expenses. Understanding your baseline enables intelligent decisions.
Next week, request detailed quotes from providers representing each pricing model. Insist on complete transparency regarding all fees and requirements. Compare total cost projections using your actual volume data. Check references to verify service quality claims.
Within 30 days, make your decision and begin the transition process. Analysis paralysis helps nobody. Perfect information doesn’t exist, but you’ll have sufficient data for an informed choice. Start capturing benefits immediately rather than waiting for ideal conditions.
Access Professional Guidance
Understanding your specific situation requires more than general guidelines. Our comprehensive UCO Collection Cost Analysis provides customized financial projections for all three pricing models based on your actual restaurant data. Local provider recommendations reflect your geographic market and service availability. Negotiation strategies tailored to your volume and needs maximize your outcomes. Implementation timelines ensure seamless service transitions without operational disruption.
Questions deserve expert answers. Our team has analyzed this industry for over 15 years, helping more than 800 restaurants optimize their oil disposal costs. We’ve seen every pricing model, service failure, and success story. This experience translates into actionable guidance for your specific situation.
Schedule a no-pressure consultation to review your circumstances and receive honest recommendations. We’ll even refer you to competitors when they’re genuinely a better fit for your needs. Integrity matters more than commissions in building lasting industry relationships.
Your Restaurant’s Hidden Profit Center Awaits
Remember Maria from Casa Bonita? Her story doesn’t end with discovering the $3,200 mistake. After implementing insights from our analysis, she switched from “free” service to a carefully selected rebate program. Her first-year results exceeded expectations: $1,847 improvement in oil disposal costs. $540 eliminated equipment fees. $1,307 in new rebate revenue. Zero service disruptions during transition.
More importantly, Maria now views used cooking oil as an asset rather than waste. She invested in better filtration equipment, trained staff on quality procedures, and monitors commodity pricing trends. Her oil program generates over $2,000 annually while requiring less than 30 minutes monthly in management time.
Your restaurant deserves the same transformation. Whether you’re overpaying for “free” service, missing rebate opportunities, or struggling with unreliable pickups, better solutions exist. The key is understanding your options with complete transparency and making decisions based on facts rather than sales pitches.
The restaurant industry faces enough challenges without adding unnecessary UCO collection costs. Transform this necessary service from a burden into a benefit. Turn waste into profit. Make informed decisions that enhance your bottom line for years to come.
Your journey to optimized UCO collection starts with a single decision: Will you continue accepting the status quo or take control of this overlooked profit center? The choice, and the profits, are yours to claim.
Need Collection?
Used Cooking Oil & Grease
Our flagship provides services across 3 different states, New Jersey, Florida & Georgia.